
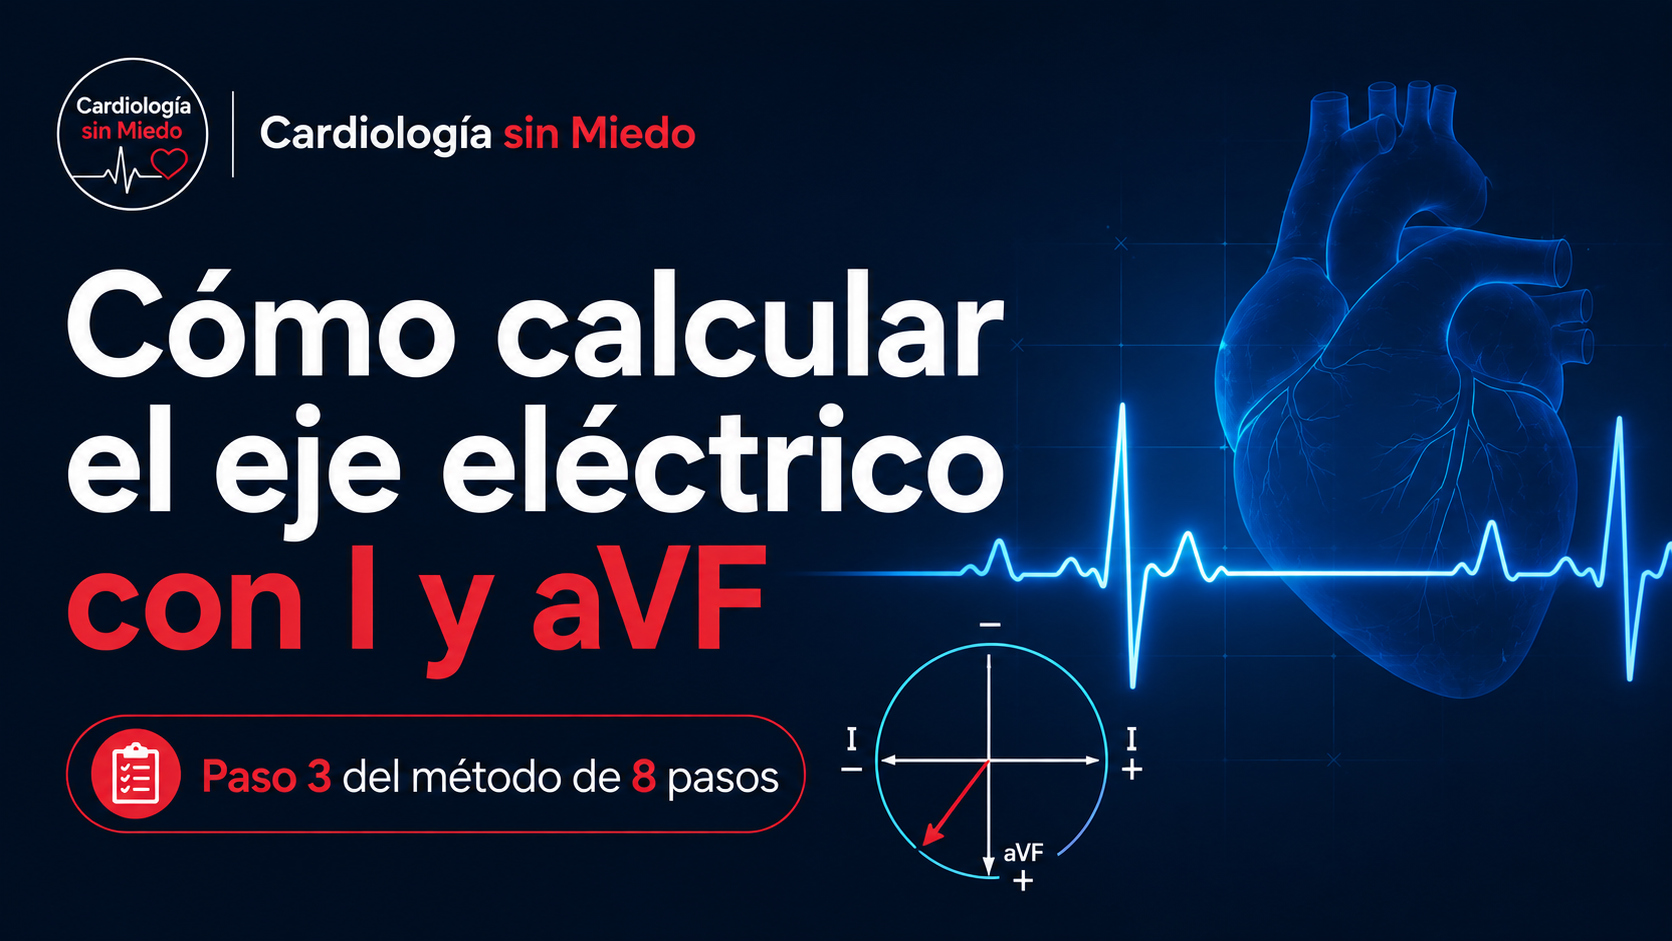
You look at lead I and the QRS points up.
Then you look at aVF and it’s mostly positive too.
With just those two observations you already know much more about the electrical axis than you probably think.
The axis is one of those concepts that feels intimidating when you’re starting out with the ECG. Circles, degrees, arrows and leads scattered everywhere show up, and it seems you need to learn geometry before you can keep reading the tracing.
But the question we’re trying to answer is much simpler: which way does ventricular depolarization head overall?
That’s step 3 of the Cardiología sin Miedo 8-step method.
If you’re not yet clear on why I, aVF and II point in different directions, it may help to review the ECG leads and the hexaxial system first.
What is the heart’s electrical axis?
When the ventricles depolarize, electrical activity doesn’t travel along a single line. Many vectors happen at once, but we can picture one predominant resulting direction.
That, put simply, is the electrical axis of the QRS.
We don’t need to picture every degree of the circle yet. For a first reading it’s enough to place that direction within a few large zones, and two leads are especially useful for that: I and aVF.
A lead tells us whether the electricity is coming toward it or going away
When the net direction of depolarization points toward a lead’s positive pole, the QRS tends to be mostly positive. When it points away, it tends to be mostly negative.
That’s why we can use the overall shape of the QRS as a kind of compass. We don’t focus on a single small wave but on the overall result: is the QRS mostly positive or mostly negative?
Don’t try to memorize four separate possibilities. Think of it this way: I tells you about the right–left component and aVF about the superior–inferior component. Combining both views lets you place the general direction of the ventricular vector.
Look at lead I first
Lead I views electrical activity in the frontal plane along a horizontal axis.
If the QRS is mostly positive in I, the overall direction of ventricular depolarization has a component toward its positive pole. If it’s mostly negative, it’s moving away from that direction.
We don’t need to decide anything else yet. Just make a mental note: I positive or I negative.
Then look at aVF
aVF views the heart from below. Again we do exactly the same thing.
Is the QRS mostly positive or negative?
Now we combine both answers.
How to calculate the ECG axis with I and aVF
| Lead I | aVF | Approximate direction |
|---|---|---|
| Positive | Positive | Axis in the usual range |
| Positive | Negative | Leftward direction; check II |
| Negative | Positive | Right axis deviation |
| Negative | Negative | Extreme axis |
For most ECGs, this first classification already tells you which zone you’re in.
As a rough guide: −30° to +90° is the usual range in adults; between −30° and −90° is left axis deviation; between +90° and +180°, right axis deviation; and between −90° and ±180°, extreme axis.
We haven’t used a protractor or calculated any degrees. We’ve only asked whether the QRS goes up or down in two leads.
What if I is positive and aVF is negative?
Here it’s worth doing one small extra check.
With I positive and aVF negative, we know the axis points to the left, but it may still be close to the limit of what’s considered usual. That’s why we look at lead II.
If II is still mostly positive, the axis may be between about 0° and −30°, a zone we usually still consider within the expected range.
If II is mostly negative, the direction has gone past about −30° and we call it left axis deviation.
I positive + aVF negative → look at II.
Normal ECG axis in adults: −30° to +90°
As a practical reference in adults, we usually consider a QRS axis of roughly −30° to +90° normal.
We don’t need to memorize every lead’s degree right now. For our method it’s enough to understand where that zone lies and why.
The anatomy and the larger mass of the left ventricle help make the usual resulting direction of ventricular depolarization point to the left and downward.
The axis isn’t an isolated number drawn on a circle. It represents which way the electricity is traveling overall.
Don’t confuse a positive R wave with a positive QRS
Finding an R wave isn’t enough. A complex can have a small R followed by a much larger S, and in that case the overall QRS is negative.
What we want to assess is the predominant net deflection. If the positive part clearly dominates, we call it positive; if the negative part dominates, we call it negative.
If the positive and negative deflections are very similar, the QRS is roughly isoelectric, or equiphasic. That’s especially useful when we want to estimate the axis more precisely on the hexaxial system.
How to calculate the axis with the most isoelectric lead
The I, aVF and II method is enough to classify the axis quickly on most ECGs. But if we want a more precise estimate, we can use the most isoelectric lead in the frontal plane.
The idea is simple: when the QRS has positive and negative deflections of similar size in a lead, the mean vector of ventricular depolarization points roughly perpendicular to that lead, about 90° from it.
The procedure comes down to three steps:
- Among I, II, III, aVR, aVL and aVF, find the lead whose QRS is most isoelectric or equiphasic.
- On the hexaxial system, find the two directions at 90° to that lead.
- Look at which leads have a clearly positive QRS to decide which of the two directions is right.
Example: isoelectric aVL
Say aVL, at about −30°, is the most isoelectric lead. The axis has to be roughly perpendicular to it, so there are two possibilities: +60° or −120°.
Now we look at the rest of the ECG. If I, II and aVF are mostly positive, the electricity is heading into the lower left quadrant and we can choose the first option:
Approximate axis: +60°.
You don’t always need to calculate the exact axis in degrees. This method is especially useful when you want to refine an estimate, check a borderline case or understand better why the hexaxial system works.
If you can’t yet picture where I, II, III, aVR, aVL and aVF sit in space, first review the ECG leads and the hexaxial system.
What does axis deviation mean?
Finding axis deviation doesn’t automatically mean finding a specific disease.
The axis can change for different reasons, including anatomical features, conduction disorders or changes in ventricular mass.
When left axis deviation is marked, the axis may be the clue to a conduction disorder. In that setting it’s worth checking for left anterior fascicular block (LAFB): the axis alone isn’t enough, so also look for the qR morphology in I/aVL and rS in II, III and aVF. If there’s also a right bundle branch block, review the bifascicular block pattern.
That’s why we keep the same philosophy as the method: first describe what you see, then integrate it with the rest of the ECG.
A routine that takes a few seconds
When you reach step 3, the sequence can be very simple:
Look at I → look at aVF → if needed, look at II.
I positive and aVF positive: axis in the usual range.
I positive, aVF negative and II negative: left axis deviation.
I negative and aVF positive: right axis deviation.
Quick checklist for step 3
| Check | What to ask yourself |
|---|---|
| Lead I | Is the QRS mostly positive or negative? |
| aVF | Is it mostly positive or negative? |
| Lead II | If I is positive and aVF negative, is II still positive? |
| Direction | Is the axis in the usual range, left, right or extreme? |
| Integration | Does it make sense with the rest of the ECG? |
The ECG hexaxial system: don’t memorize the circle before you understand the arrow
Later we can learn to calculate the axis more precisely, find the most isoelectric lead or place it on the hexaxial system.
But if we don’t first understand what we’re doing, all of that ends up as one more memorized rule.
The core idea is simple: each lead views the electricity from one direction, and the QRS tells us whether the net vector is coming toward it or going away.
If you haven’t gone through the previous step yet, you can go back to rate, regularity and the origin of the rhythm. And if you want to see the whole structure, there’s the 8-step method for reading an ECG.
Frequently asked questions about the ECG axis
What is the normal electrical axis in an adult?
As a practical reference, the QRS axis is usually considered normal between roughly −30° and +90°.
How do you quickly calculate the axis with I and aVF?
Check whether the QRS is mostly positive or negative in I and aVF. If both are positive, the axis is between 0° and +90°. If I is positive and aVF negative, look at II to tell an axis between 0° and −30° from left axis deviation.
What does left axis deviation mean?
It describes an axis between roughly −30° and −90°. It’s a finding that can appear in different settings and doesn’t point to a specific cause on its own.
What does right axis deviation mean?
It describes an axis between roughly +90° and +180°. Like left axis deviation, it has to be integrated with the rest of the ECG and the clinical context.
Do you have to calculate the exact axis in degrees?
Not for a first systematic reading. On many ECGs it’s enough to classify it as usual, left deviation, right deviation or extreme. If you need more precision, you can use the hexaxial system and the most isoelectric lead.
Related articles
The next step
We know the ECG is reliable, we’ve looked at how the heart is beating and we’ve placed the overall direction of ventricular depolarization.
Now we go back to the atria and to conduction between atria and ventricles.
In step 4 we’ll analyze the P wave and the PR interval: what they tell us about atrial activation and about how long the impulse takes to reach the ventricles.
If you want to go further than these articles, the YouTube channel (in Spanish) and El idioma del ECG (a book in Spanish) will develop the method in more depth and with more visual support.
8-step method · Step 3 of 8
About this content
Written by Cardiología sin Miedo. This article is part of the Cardiología sin Miedo 8-step method, the project’s own teaching structure for organizing how you read an ECG.
Last editorial review: November 21, 2026 · About the project
References
- El idioma del ECG. Cardiología sin Miedo. Chapter 6: Rate, rhythm and axis: the first three answers (in Spanish).
Educational note. This content is for educational purposes and is aimed mainly at students and healthcare professionals. ECG interpretation must be integrated with the patient’s clinical situation and doesn’t replace professional assessment, care protocols or current clinical guidelines.
Practice and measure: compare a normal axis, left deviation, right deviation and extreme axis in the online ECG generator. Then enter the net QRS of I and aVF in the online ECG calculator to estimate the frontal angle.
Leave a Reply